Triple Your Organic Traffic in 90 Days: The Multi-Format Content Strategy Google Rewards
Picture this: You spend weeks crafting the perfect 3,000-word guide. Your research is solid, your writing is sharp, and your information could change lives. Yet your organic traffic from Google crawls along at the same sluggish pace.
Here’s the hard truth most content creators refuse to face: Single-format content is digital suicide in 2025.
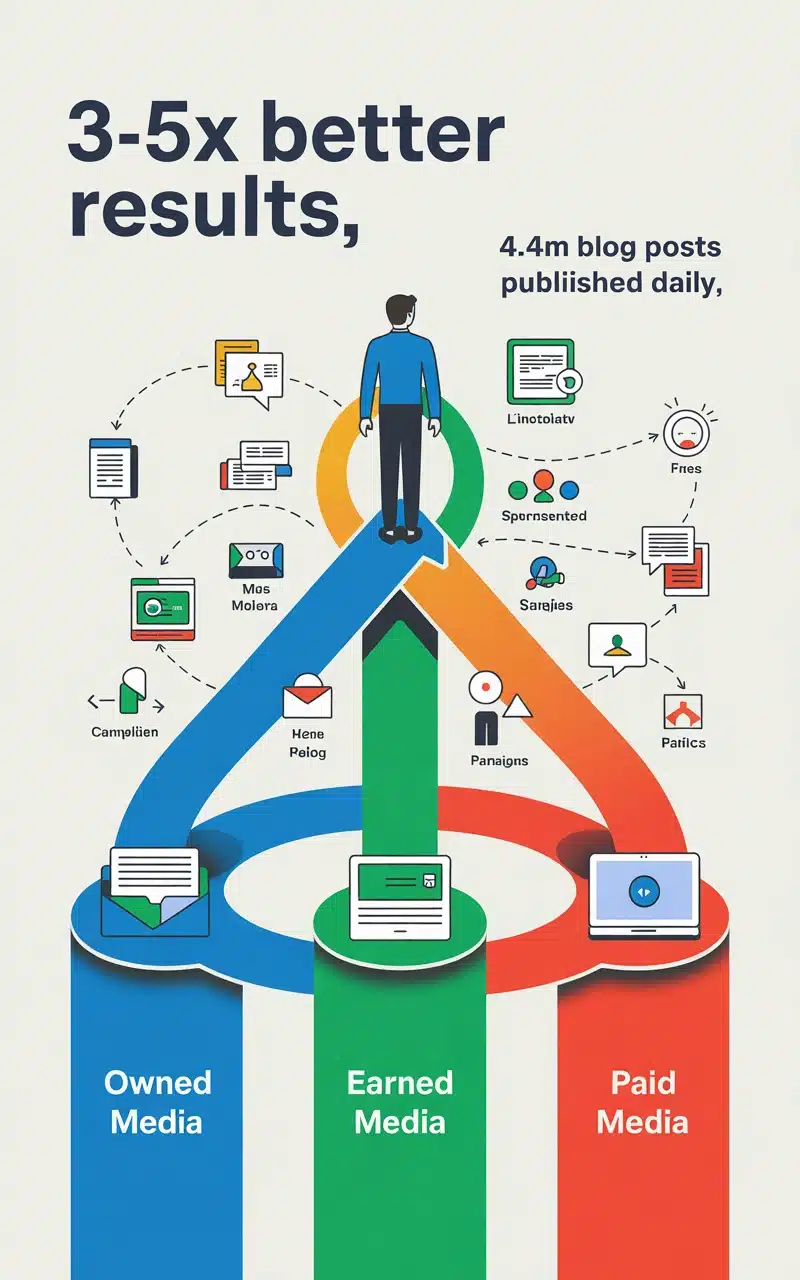
Recent studies show that businesses using a multimedia content mix strategy see a 300% increase in organic traffic compared to text-only approaches. Meanwhile, companies stuck in the “blog post only” mindset watch their competitors climb past them in search results.
The problem isn’t your writing quality or your expertise. The problem is that you’re speaking one language to an audience that speaks three.
Why Your One-Trick Content Pony Is Failing You
Think about your content consumption habits. When you need quick answers, do you read a 2,000-word article or watch a 3-minute video? When you’re researching a complex topic, do you prefer detailed text or visual breakdowns?
Your audience has the same varied preferences, yet most businesses force-feed them a single content format.
The Learning Style Reality:
- 65% of people are visual learners who process images 60,000 times faster than text
- 30% prefer auditory content (videos, podcasts, audio explanations)
- 5% learn best through text-only formats
When you publish only blog posts, you’re actively ignoring 95% of how people naturally process information.
Google’s algorithm has caught onto this human behavior pattern. The search engine now rewards websites that satisfy different user preferences within the same topic. Pages featuring SEO-friendly multimedia formats consistently outrank text-only competitors.
User Engagement Drops Tell the Story:
- Text-only pages: Average 37 seconds time-on-page
- Text + images: Average 1 minute 23 seconds
- Text + images + video: Average 2 minutes 47 seconds
That engagement difference translates directly into ranking improvements. Google interprets longer page visits as content quality signals.
The Science Behind Multi-Format Success
Your brain processes different content types through completely different neural pathways. This isn’t marketing theory – it’s cognitive science.
Text Content Processing: Text activates the brain’s language centers in the left hemisphere. Readers must decode symbols, process meaning, and construct mental images. This sequential processing takes significant mental energy and time.
Visual Content Processing: Images bypass language centers entirely. Your visual cortex processes pictures instantly, creating immediate understanding. This explains why infographics convey complex data faster than paragraphs of explanation.
Video Content Processing: Videos combine visual and auditory channels, activating multiple brain regions simultaneously. This dual-coding creates stronger memory formation and higher retention rates.
Retention Rate Breakdown:
- Text alone: 10% retention after 3 days
- Text + relevant images: 65% retention after 3 days
- Video content: 95% retention after 3 days
These retention differences impact user behavior patterns that Google tracks closely. When users remember and return to your content, search algorithms interpret this as quality and relevance signals.
Modern search algorithms in 2025 specifically look for content that satisfies the “multimedia content creation services” approach – meaning they want to see businesses providing information through multiple channels, not just one.
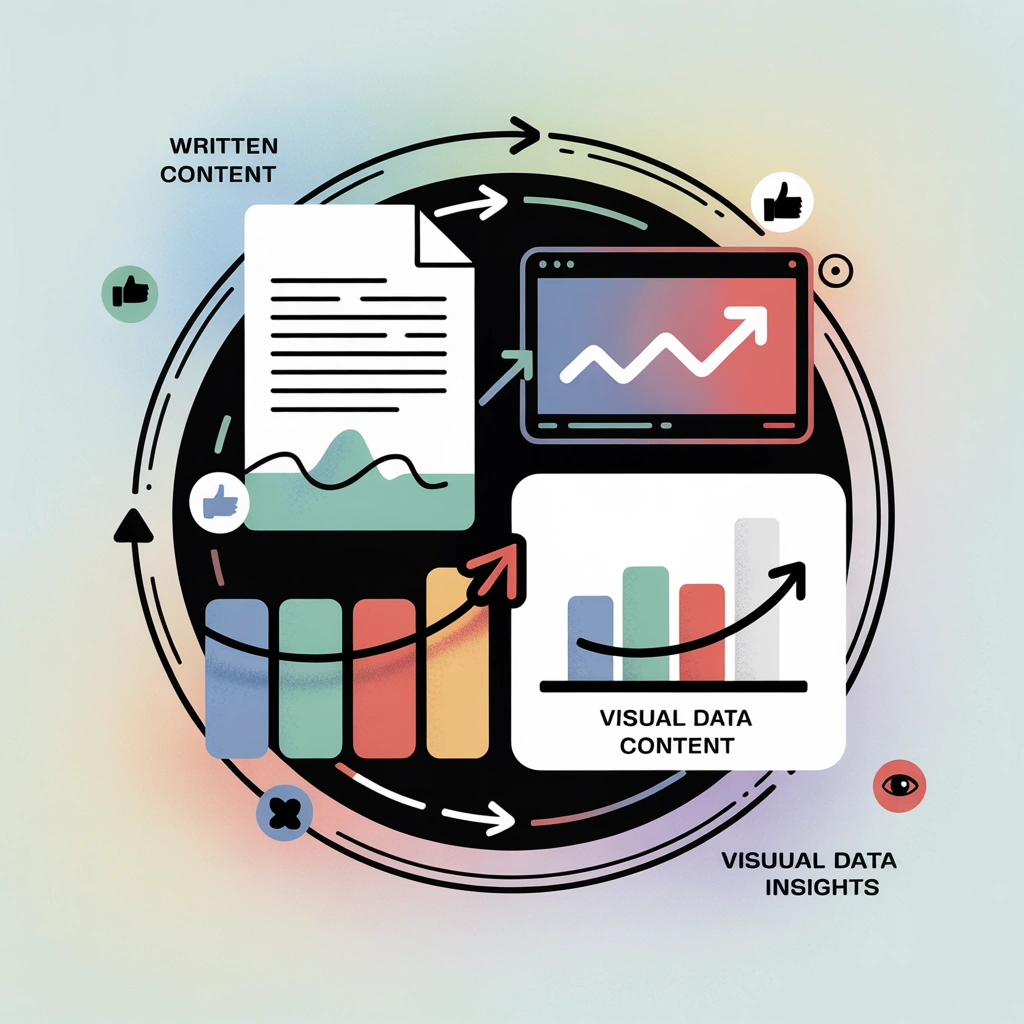
Text Content: Your Strategic Foundation
Despite the rise of visual and video content, text remains the backbone of your online presence. Written content provides the detailed, searchable information that forms your digital authority.
Long-Form Articles for Deep Authority: Comprehensive guides of 2,000-3,000 words establish subject matter expertise. These pieces target users in research phases who need thorough information before making decisions.
Quick-Read Formats for Time-Pressed Users: Bullet-pointed summaries, numbered lists, and scannable formats serve users who need immediate answers. These shorter pieces often drive higher traffic volume but lower conversion rates.
Technical Documentation Builds Trust: How-to guides, step-by-step tutorials, and detailed explanations position you as a reliable resource. Users bookmark and return to well-structured instructional content.
Text Content Best Practices:
- Use descriptive headers that work as standalone pieces
- Include relevant data and statistics to support claims
- Structure content with clear hierarchies (H2, H3, bullet points)
- Write conversational yet authoritative language
- Include internal links to related multimedia content
The key is making your text content work as both standalone pieces and launching points for your visual and video materials.

Video Content: The Engagement Champion
Video has become the heavyweight champion of content engagement. Compared to text-only sites, users spend 88% more time on websites featuring video content.
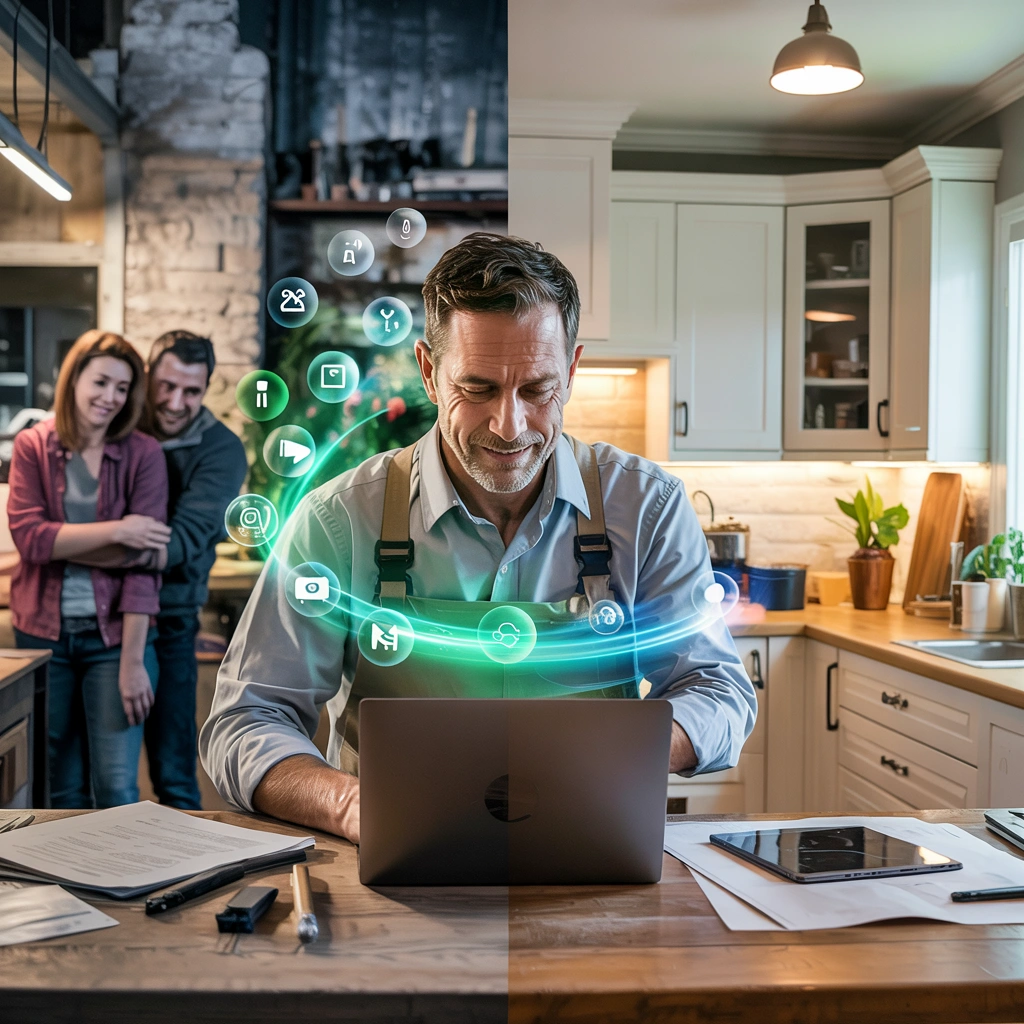
Why Video Keeps Users Hooked: Videos create immediate emotional connections. Viewers see facial expressions, hear voice tones, and simultaneously process information through multiple senses. This multi-sensory experience builds trust faster than written words alone.
Video Formats That Google Prioritizes:
- Tutorial Videos (2-5 minutes)
- Step-by-step demonstrations
- Screen recordings with voiceovers
- Problem-solving walkthroughs
- Explanation Videos (1-3 minutes)
- Concept breakdowns
- Industry insights
- Quick tips and tricks
- Case Study Videos (3-7 minutes)
- Customer success stories
- Before-and-after examples
- Results demonstrations
Production Tips for Maximum Impact:
- Start with a compelling hook in the first 10 seconds
- Use clear audio (poor sound quality kills engagement)
- Include captions for accessibility and silent viewing
- Keep backgrounds simple to avoid distraction
- End with clear next steps or calls-to-action
Technical Considerations: Upload videos directly to your website rather than only hosting on external platforms. This keeps users on your domain longer while still allowing you to cross-post to social platforms for wider reach.
Include video transcripts below each video. This provides searchable text content while making your videos accessible to hearing-impaired users and those who prefer reading.
Visual Content: The Quick Communicator
Images process faster than any other content type, making them perfect for immediate communication and emotional impact.
Strategic Visual Content Types:
Custom Infographics for Complex Data: Transform statistics, processes, and comparisons into digestible visual formats. Infographics earn 3x more shares than text-only content and significantly increase comprehension rates.
Screenshots for Step-by-Step Tutorials: Nothing beats visual proof when teaching processes. Annotated screenshots guide users through complex procedures better than written instructions alone.
Custom Photography vs. Stock Images: Original photos outperform stock images by 35% in engagement metrics. Users can spot generic stock photos instantly, which reduces trust and credibility.
Visual Content Best Practices:
- Optimize image file sizes for fast loading (under 100KB when possible)
- Use descriptive file names (tutorial-step-3.jpg instead of IMG_001.jpg)
- Include alt text that describes the image content
- Maintain consistent visual branding across all images
- Create images that work on both desktop and mobile displays
Tools for Non-Designers:
- Canva for social media graphics and simple infographics
- Snagit for screenshot annotation and editing
- Unsplash for high-quality stock photos when needed
- GIMP or Canva for basic photo editing
Remember: Your images should enhance and clarify your written content, not just decorate it. Every visual element should serve a specific purpose in helping users understand your message.
Integration Strategies That Actually Work
The real magic happens when you stop thinking about formats as separate entities and start building integrated content ecosystems.
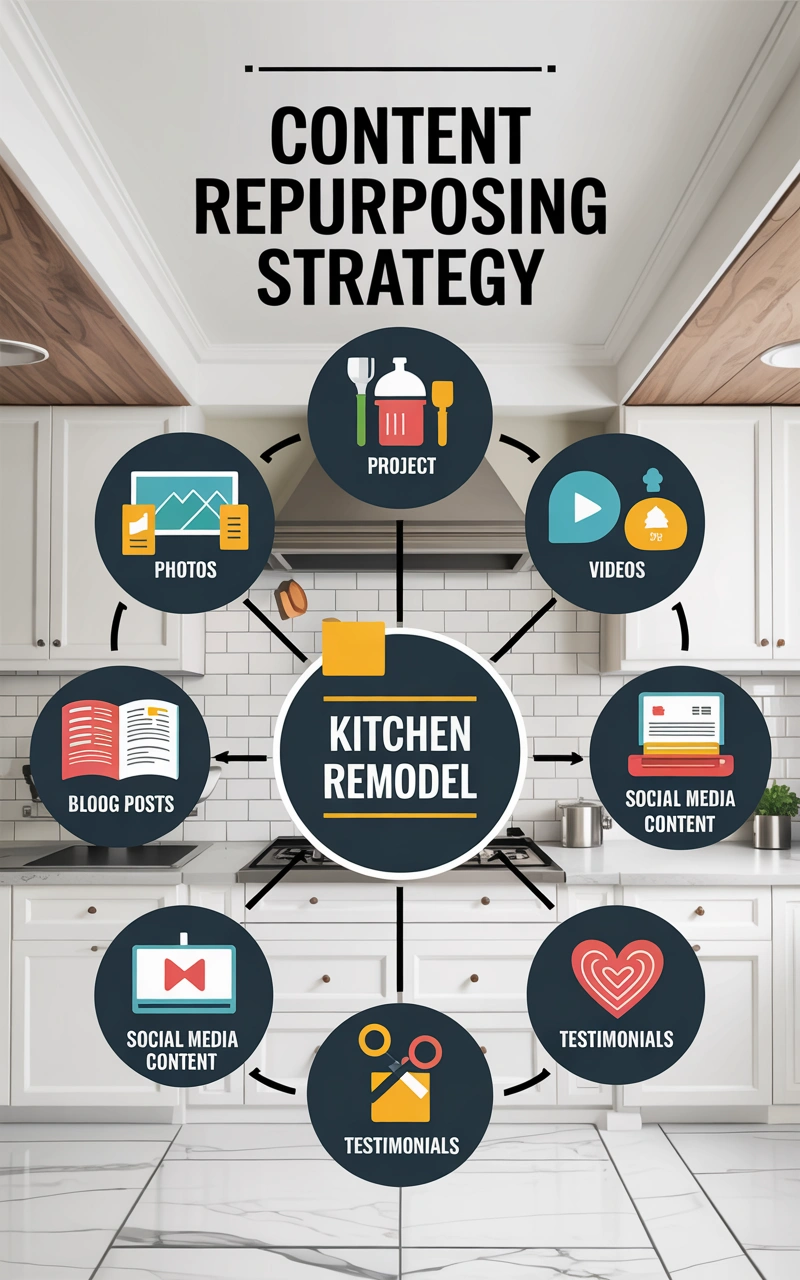
Content Repurposing Across Formats:
Start with your strongest format, then adapt the content rather than creating from scratch each time.
From Text to Visual:
- Turn blog post headers into infographic sections
- Convert step-by-step instructions into annotated screenshots
- Transform data points into charts and graphs
From Video to Text:
- Use video transcripts as blog post foundations
- Extract key quotes for social media posts
- Create FAQ sections from common video comments
From Visual to Video:
- Animate static infographics into explainer videos
- Use image sequences to create slideshow presentations
- Turn screenshots into screen-recorded tutorials
Cross-Referencing Between Formats:
Create content webs where each format supports and enhances the others:
- Include video summaries in long-form articles
- Add related article links in video descriptions
- Use infographics as visual breaks in text content
- Reference detailed guides in quick-tip videos
Technical Implementation Tips:
Structured Data Markup: Use schema markup to help search engines understand the relationships between your different content formats. This can lead to rich snippets in search results.
Content Clusters: Group related content pieces together through internal linking. Create pillar pages (comprehensive guides) supported by cluster content (specific videos, infographics, tutorials).
Loading Speed Optimization: Multimedia content can slow down page loading if not properly optimized. Use:
- Lazy loading for images and videos
- Compressed file formats (WebP for images, MP4 for videos)
- Content delivery networks (CDNs) for faster loading
Measuring Your Multi-Format Success
You can’t improve what you don’t measure. Track these specific metrics to understand how your multimedia content mix strategy performs:
Engagement Metrics:
- Time spent on page (should increase with multimedia)
- Scroll depth (how far users scroll through content)
- Click-through rates to related content
- Social sharing rates by content type
Performance Metrics:
- Organic traffic growth month-over-month
- Keyword ranking improvements
- The featured snippet captures
- Local search visibility improvements
Tools for Monitoring Performance:
- Google Analytics 4:
- Track engagement events
- Monitor page performance
- Analyze user behavior flows
- Google Search Console:
- Monitor keyword rankings
- Track click-through rates
- Identify content opportunities
- Hotjar or Similar Heat Mapping Tools:
- See how users interact with different content types
- Identify drop-off points in the content
- Understand scroll patterns and engagement
When to Adjust Your Strategy:
Review your metrics monthly and look for these warning signs:
- Decreasing time-on-page despite adding multimedia
- Lower engagement rates on specific content types
- Declining organic traffic growth rates
- High bounce rates on multimedia pages
Common Mistakes That Kill Multi-Format Success
Format Mismatch with Audience Needs: Creating videos for topics that need detailed documentation, or writing lengthy articles for simple questions. Match format complexity to user intent.
Technical Errors That Hurt Rankings:
- Slow-loading pages due to unoptimized multimedia
- Missing alt text on images
- Videos without transcripts
- Broken internal links between formats
Resource Allocation Problems: Spreading your team too thin across all formats instead of mastering 2-3 formats first. Start with your strengths, then expand gradually.
Consistency Issues: Publishing sporadically across formats confuses both users and search algorithms. Better to publish consistently in fewer formats than inconsistently across many.
Your 30-Day Action Plan for 2025
Week 1: Audit and Plan
- Analyze your current content performance
- Identify your top 10 performing pieces
- Choose 2-3 formats to focus on initially
- Create a content calendar for integration
Week 2: Content Creation
- Transform your best text content into one video
- Create 3-5 supporting images for existing articles
- Write transcripts for any existing videos
- Plan your first integrated content piece
Week 3: Technical Setup
- Optimize existing images for faster loading
- Add proper alt text to all images
- Set up video hosting and embedding
- Create an internal linking structure
Week 4: Launch and Monitor
- Publish your first integrated content piece
- Share across appropriate platforms
- Monitor initial performance metrics
- Plan next month’s content based on results
Budget Allocation Recommendations:
- Small Business (Under $50K revenue): 60% text, 30% images, 10% video
- Growing Business ($ 50 K-$500 K revenue): 40% text, 35% images, 25% video
- Established Business ($500K+ revenue): 30% text, 30% images, 40% video
Team Structure for Success:
- Solo Creator: Master one additional format every 3 months
- Small Team (2-3 people): Assign format specialties while cross-training
- Larger Team (4+ people): Dedicated specialists with an integration coordinator
The businesses winning in 2025 understand that multimedia content benefits extend far beyond just ranking improvements. They’re building deeper connections with their audiences, increasing conversion rates, and creating sustainable competitive advantages.
Your multimedia content creation services approach doesn’t need to be perfect from day one. Start with your strengths, add one new format at a time, and measure everything. The companies that adapt their content strategies now will dominate their markets while their competitors scramble to catch up.
The question isn’t whether you should adopt a multi-format approach – it’s whether you can afford not to.
Ready to transform your content strategy? Start with your best-performing piece right now. Choose one additional format and create a companion piece this week. Your future traffic numbers will thank you.
Grow Your Business – Get More Customers – Learn How it Works!